freealg.distributions.Meixner.stieltjes#
- Meixner.stieltjes(x=None, y=None, plot=False, on_disk=False, latex=False, save=False, **kwargs)#
Stieltjes transform of distribution.
- Parameters:
- xnumpy.array, default=None
The x axis of the grid where the Stieltjes transform is evaluated. If None, an interval slightly larger than the support interval of the spectral density is used.
- ynumpy.array, default=None
The y axis of the grid where the Stieltjes transform is evaluated. If None, a grid on the interval
[-1, 1]is used.- plotbool, default=False
If True, Stieltjes transform is plotted.
- on_diskbool, default=False
If True, the Stieltjes transform is mapped on unit disk. This option relevant only if
plot=True.- latexbool, default=False
If True, the plot is rendered using LaTeX. This option is relevant only if
plot=True.- savebool, default=False
If not False, the plot is saved. If a string is given, it is assumed to the save filename (with the file extension). This option is relevant only if
plot=True.- **kwargsdict
Parameters to pass to
freealg.visualization.domain_coloring().
- Returns:
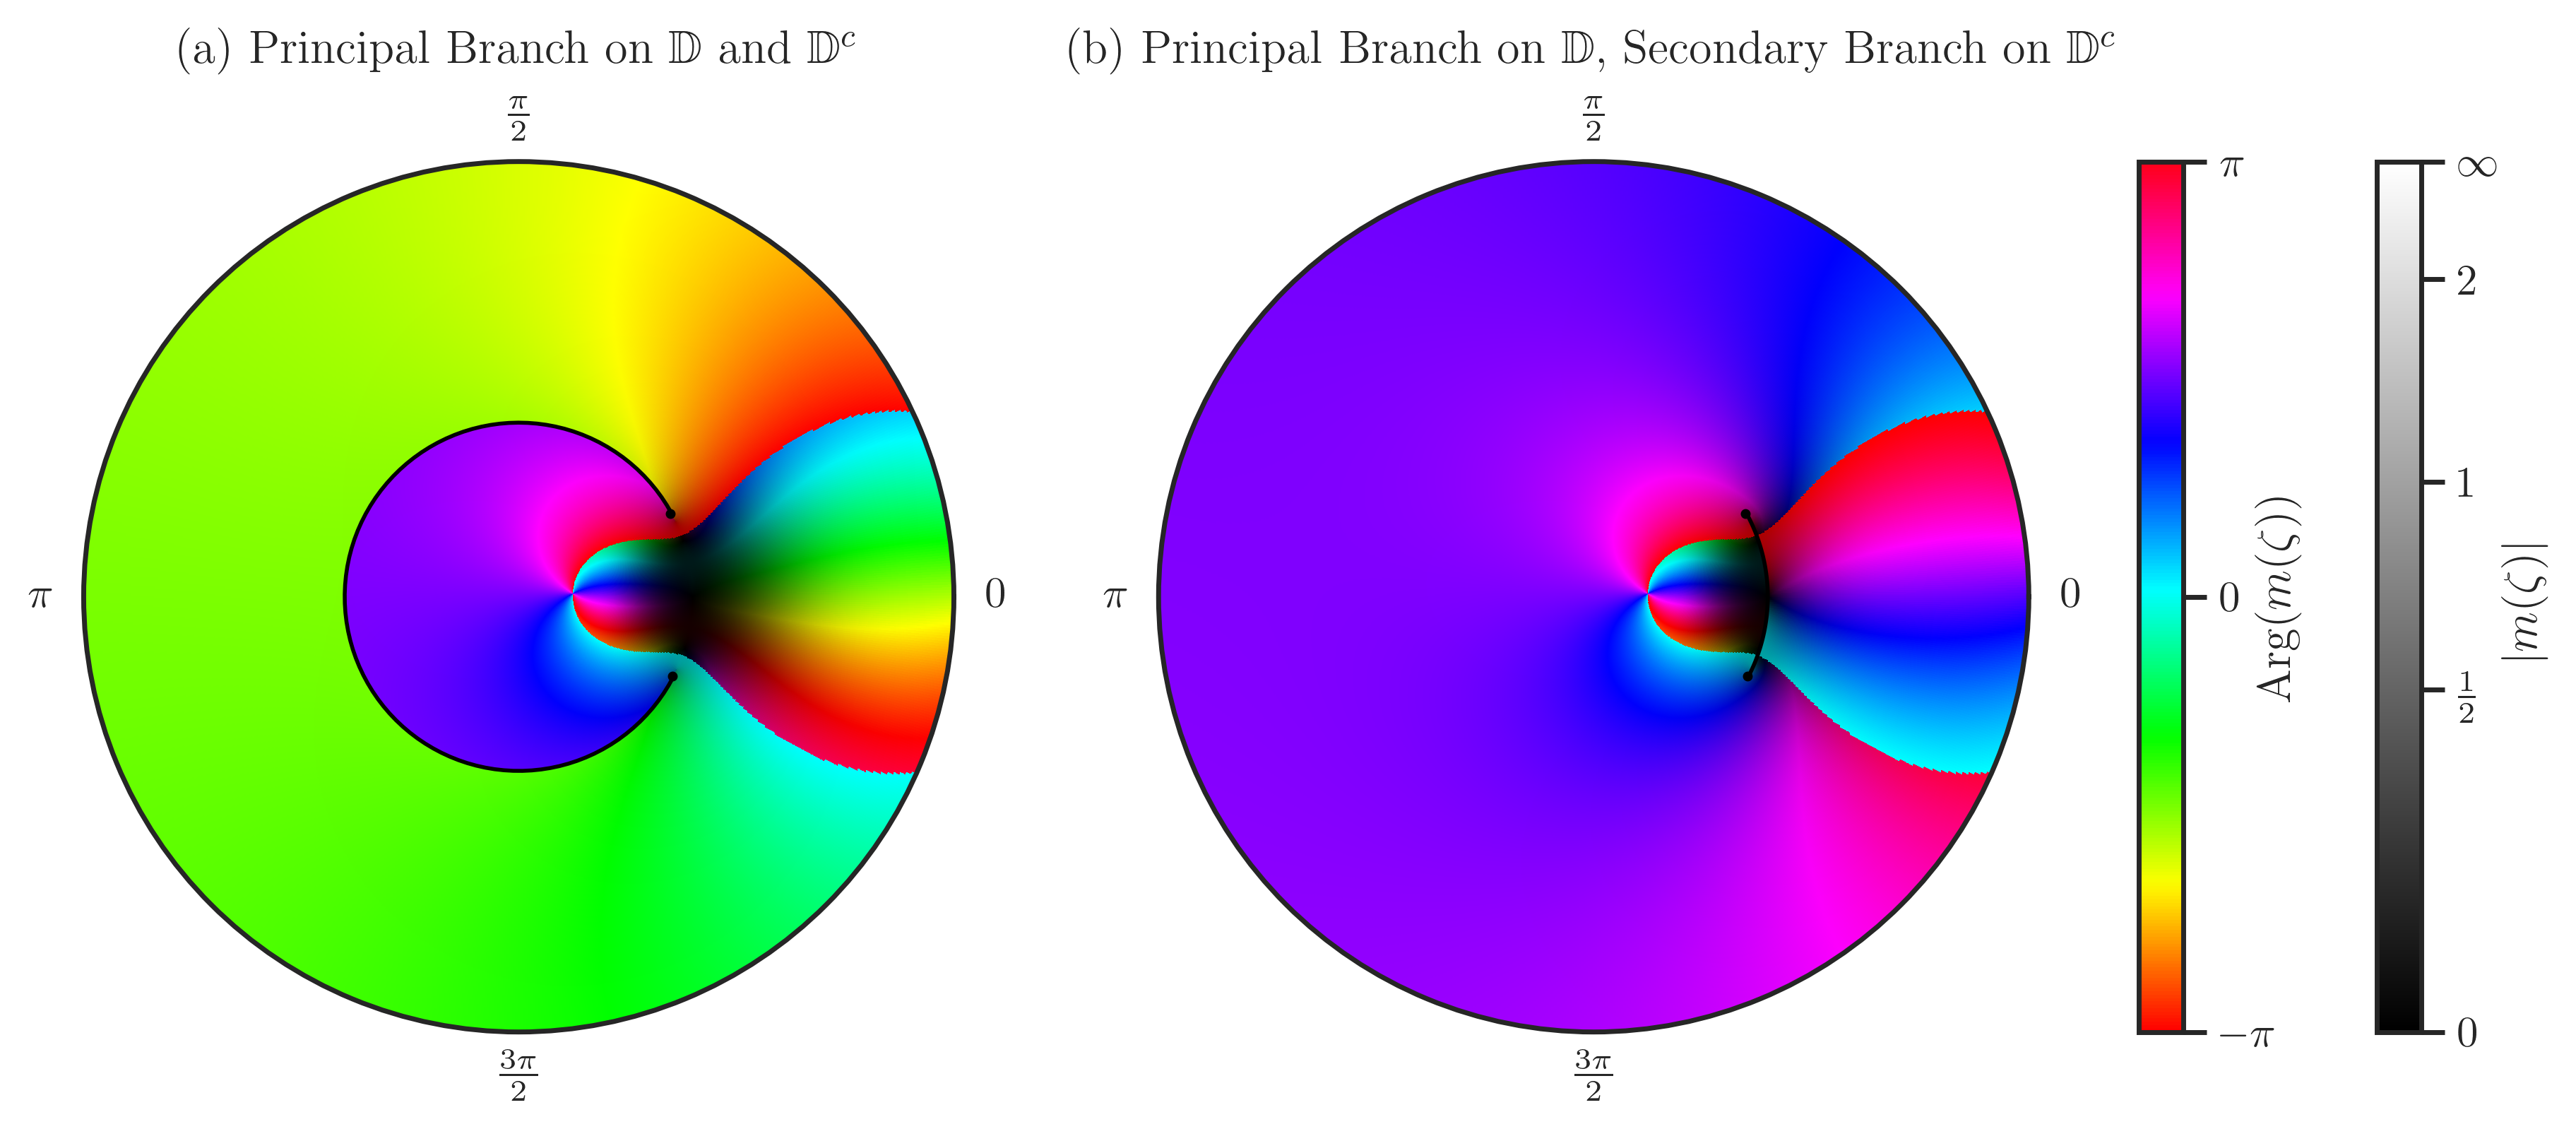
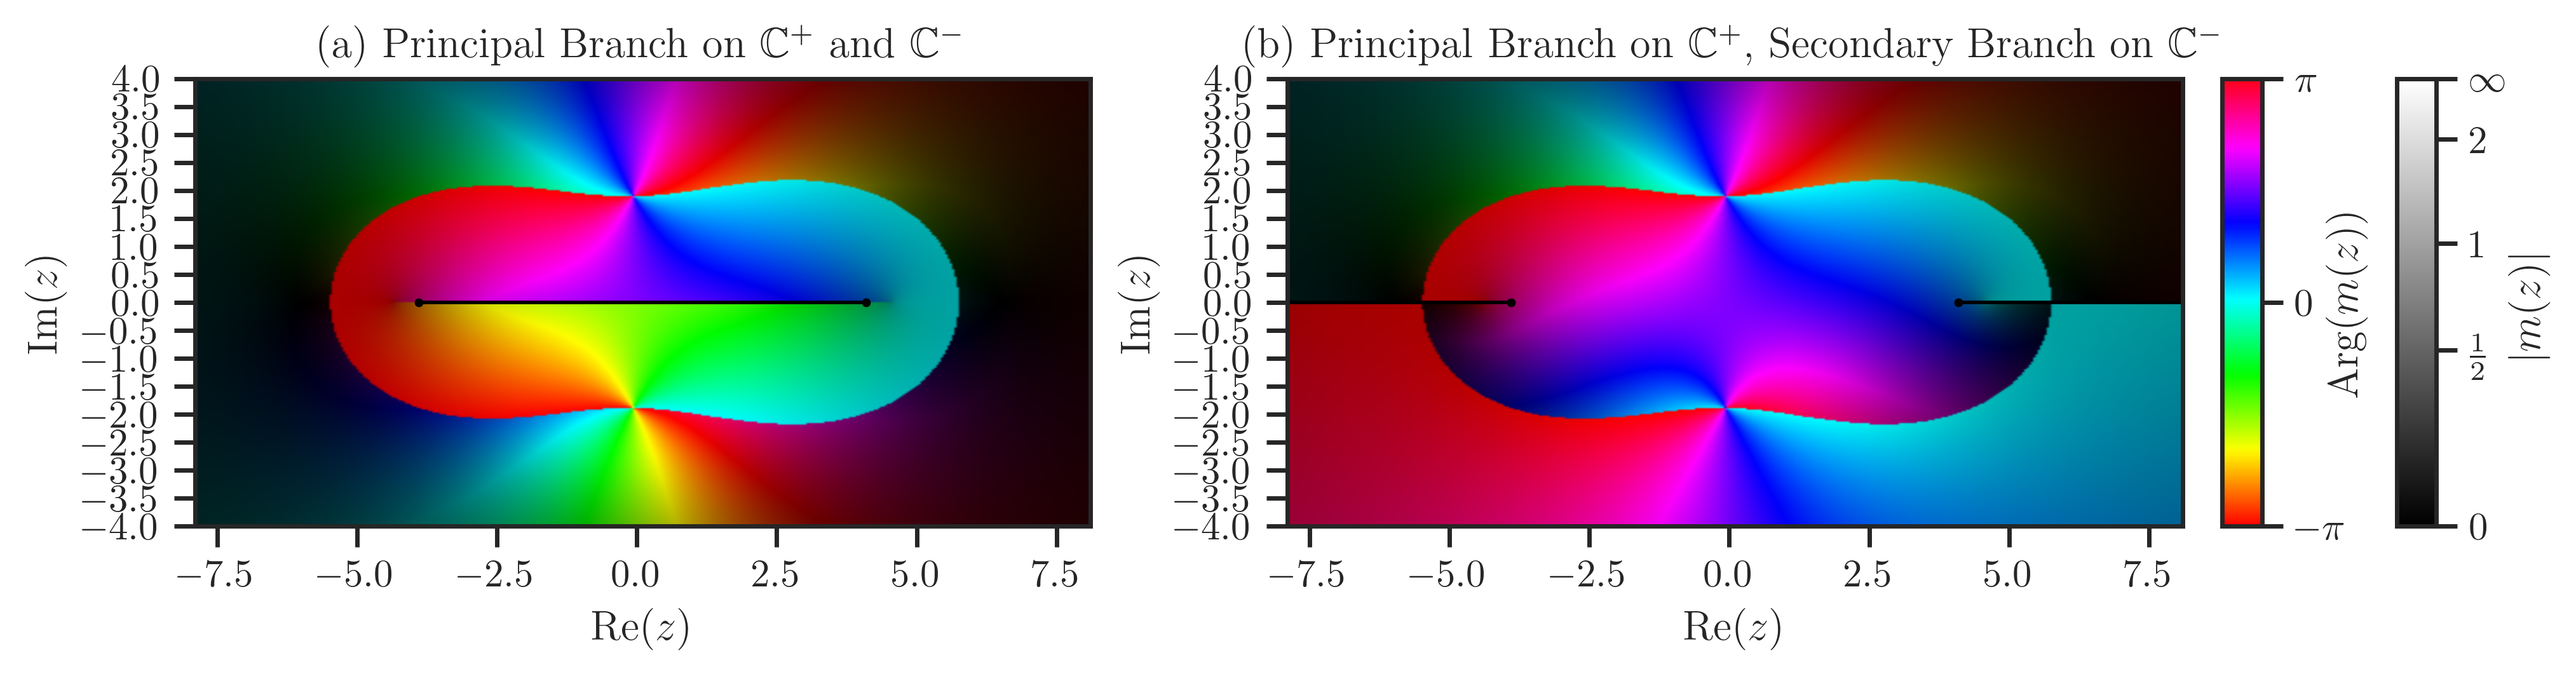
- m1numpy.array
Stieltjes transform on principal branch.
- m12numpy.array
Stieltjes transform on secondary branch.
Examples
>>> from freealg.distributions import Meixner
>>> mx = Meixner(2, 3)
>>> m1, m2 = mx.stieltjes(plot=True)
Plot on unit disk using Cayley transform:
>>> m1, m2 = mx.stieltjes(plot=True, on_disk=True)