freealg.distributions.Wigner.hilbert#
- Wigner.hilbert(x=None, plot=False, latex=False, save=False)#
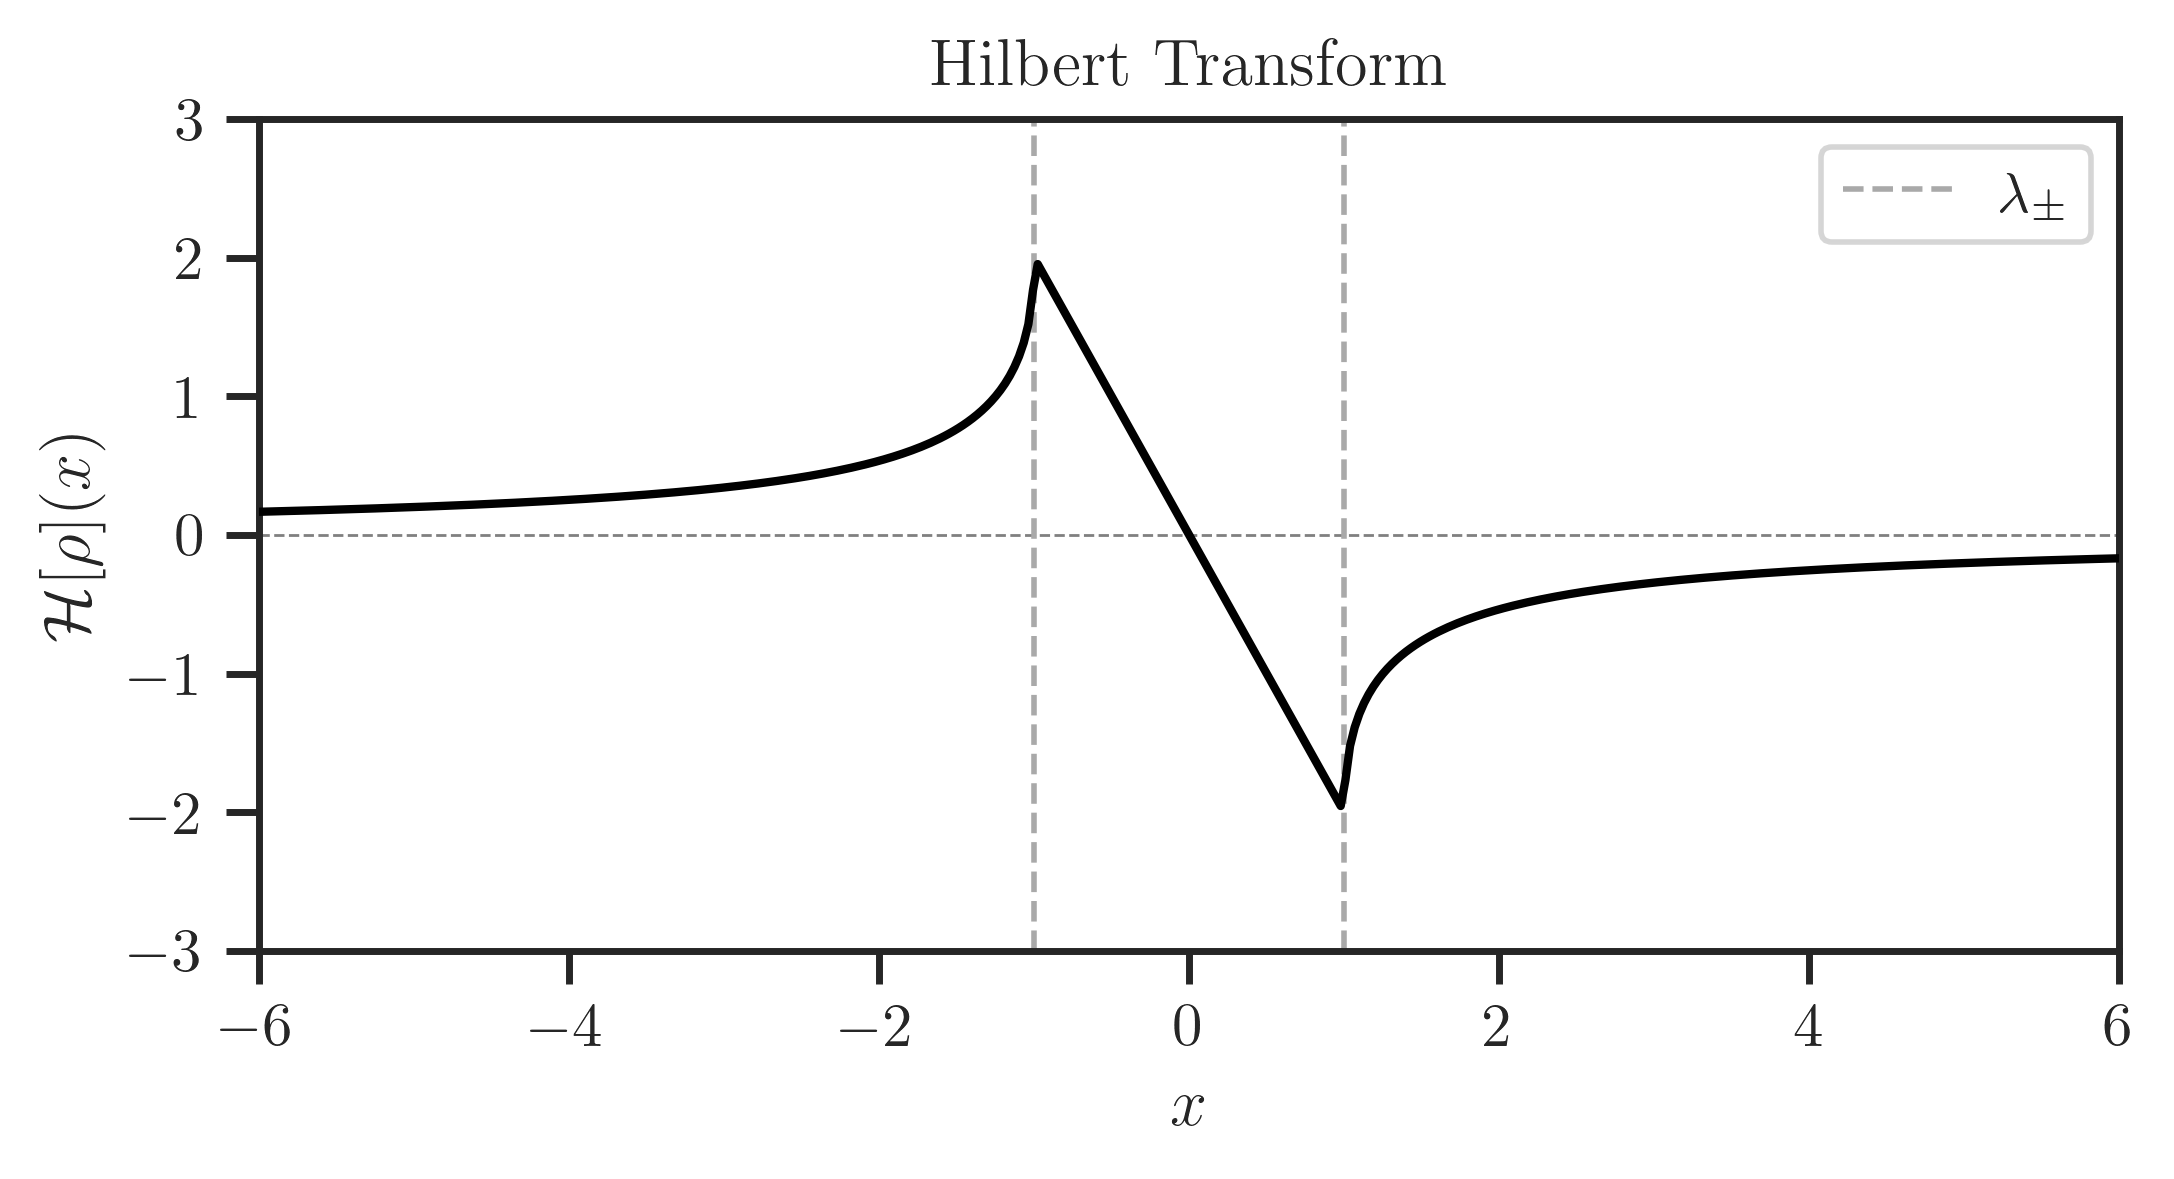
Hilbert transform of the distribution.
- Parameters:
- xnumpy.array, default=None
The locations where Hilbert transform is evaluated at. If None, an interval slightly larger than the support interval of the spectral density is used.
- plotbool, default=False
If True, Hilbert transform is plotted.
- latexbool, default=False
If True, the plot is rendered using LaTeX. This option is relevant only if
plot=True.- savebool, default=False
If not False, the plot is saved. If a string is given, it is assumed to the save filename (with the file extension). This option is relevant only if
plot=True.
- Returns:
- hilbnumpy.array
Hilbert transform.
Examples