glearn.sample_data.generate_data#
- glearn.sample_data.generate_data(x, noise_magnitude, seed=0, plot=False)#
Generate noisy sinusoidal data on a set of points.
- Parameters:
- xnumpy.ndarray
2D array of size \((n, d)\) representing \(n\) points where each row represents an \(d\)-dimensional coordinate of a point.
- noise_magnitudefloat
The magnitude of additive noise to the data.
- seedint, default=0
Seed of the random generator which can be a non-negative integer. If set to None, the result of the random generator is not repeatable.
- plotbool or str, default=False
If True, the data will be plotted (only if the data is 1D or 2D). If
plotis a string, the plot is not shown, rather saved with a filename as the given string. If the filename does not contain file extension, the plot is saved in bothsvgandpdfformats. If the filename does not have directory path, the plot is saved in the current directory.
- Returns:
- ynumpy.array
1D array of data of the size \(n\).
See also
Notes
Given a set of points \(\{ \boldsymbol{x}_i \}_{i = 1}^n\) in \(\mathbb{R}^d\) each with coordinates \(\boldsymbol{x}_i = (x_i^1, \dots, x_i^d)\), this function generates the data \(y_i = f(\boldsymbol{x}_i)\) where
\[y_i = \sum_{j=1}^d \sin(x_i^j \pi) + e,\]where \(e \sim \mathcal{N}(0, \epsilon)\) is an additive noise with normal distribution and noise magnitude \(\epsilon\).
Plotting:
If
plotis set to True, it plots the data.If no graphical backend exists (such as running the code on a remote server or manually disabling the X11 backend), the plot will not be shown, rather, it will be saved as an
svgfile in the current directory.If the executable
latexis available onPATH, the plot is rendered using \(\rm\LaTeX\) and it may take slightly longer to produce the plot.If \(\rm\LaTeX\) is not installed, it uses any available San-Serif font to render the plot.
To manually disable interactive plot display and save the plot as
svginstead, add the following at the very beginning of your code before importingglearn:>>> import os >>> os.environ['GLEARN_NO_DISPLAY'] = 'True'
Examples
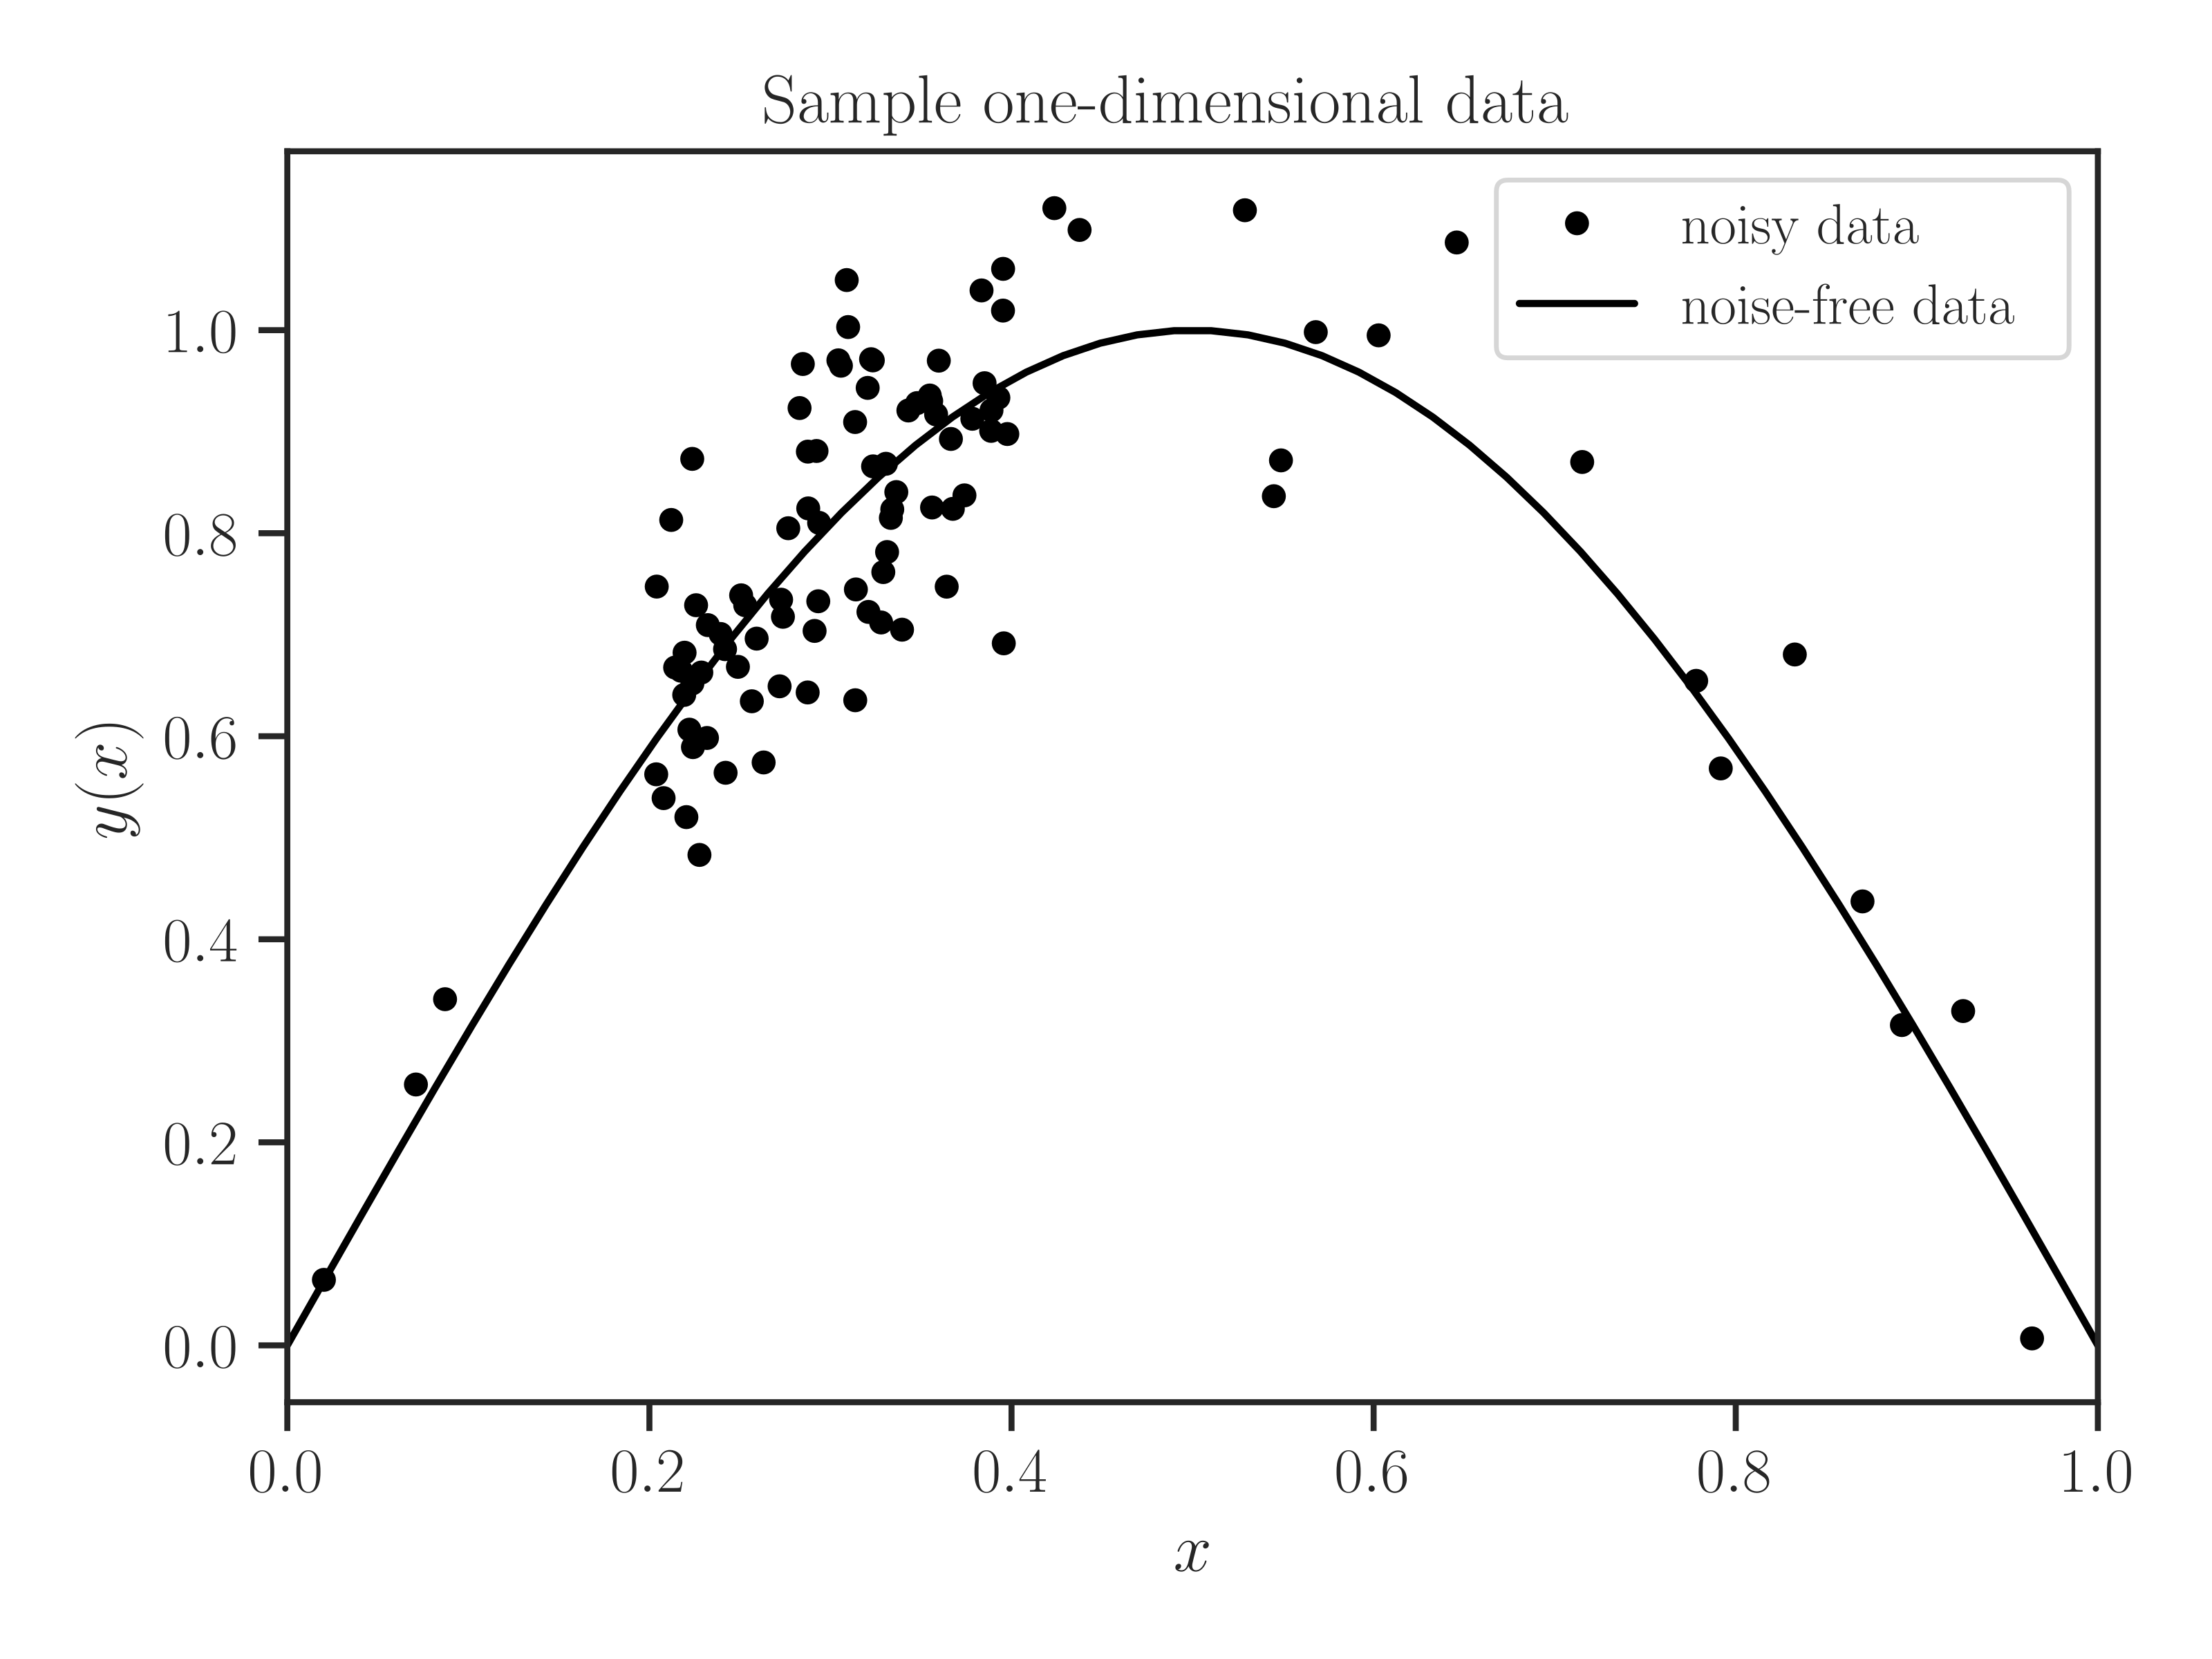
One-dimensional Data:
Generate 100 random points in a 1-dimensional interval \([0, 1]\) where \(80 \%\) more points are inside \([0.2, 0.4]\) compared to the outside of the latter interval. Then, generate a sinusoidal function with noise magnitude \(0.1\) on the points.
>>> from glearn.sample_data import generate_points, generate_data
>>> x = generate_points(100, grid=False, a=0.2, b=0.4, contrast=0.8)

>>> # Generate sample data
>>> y = generate_data(x, noise_magnitude=0.1, seed=0, plot=True)
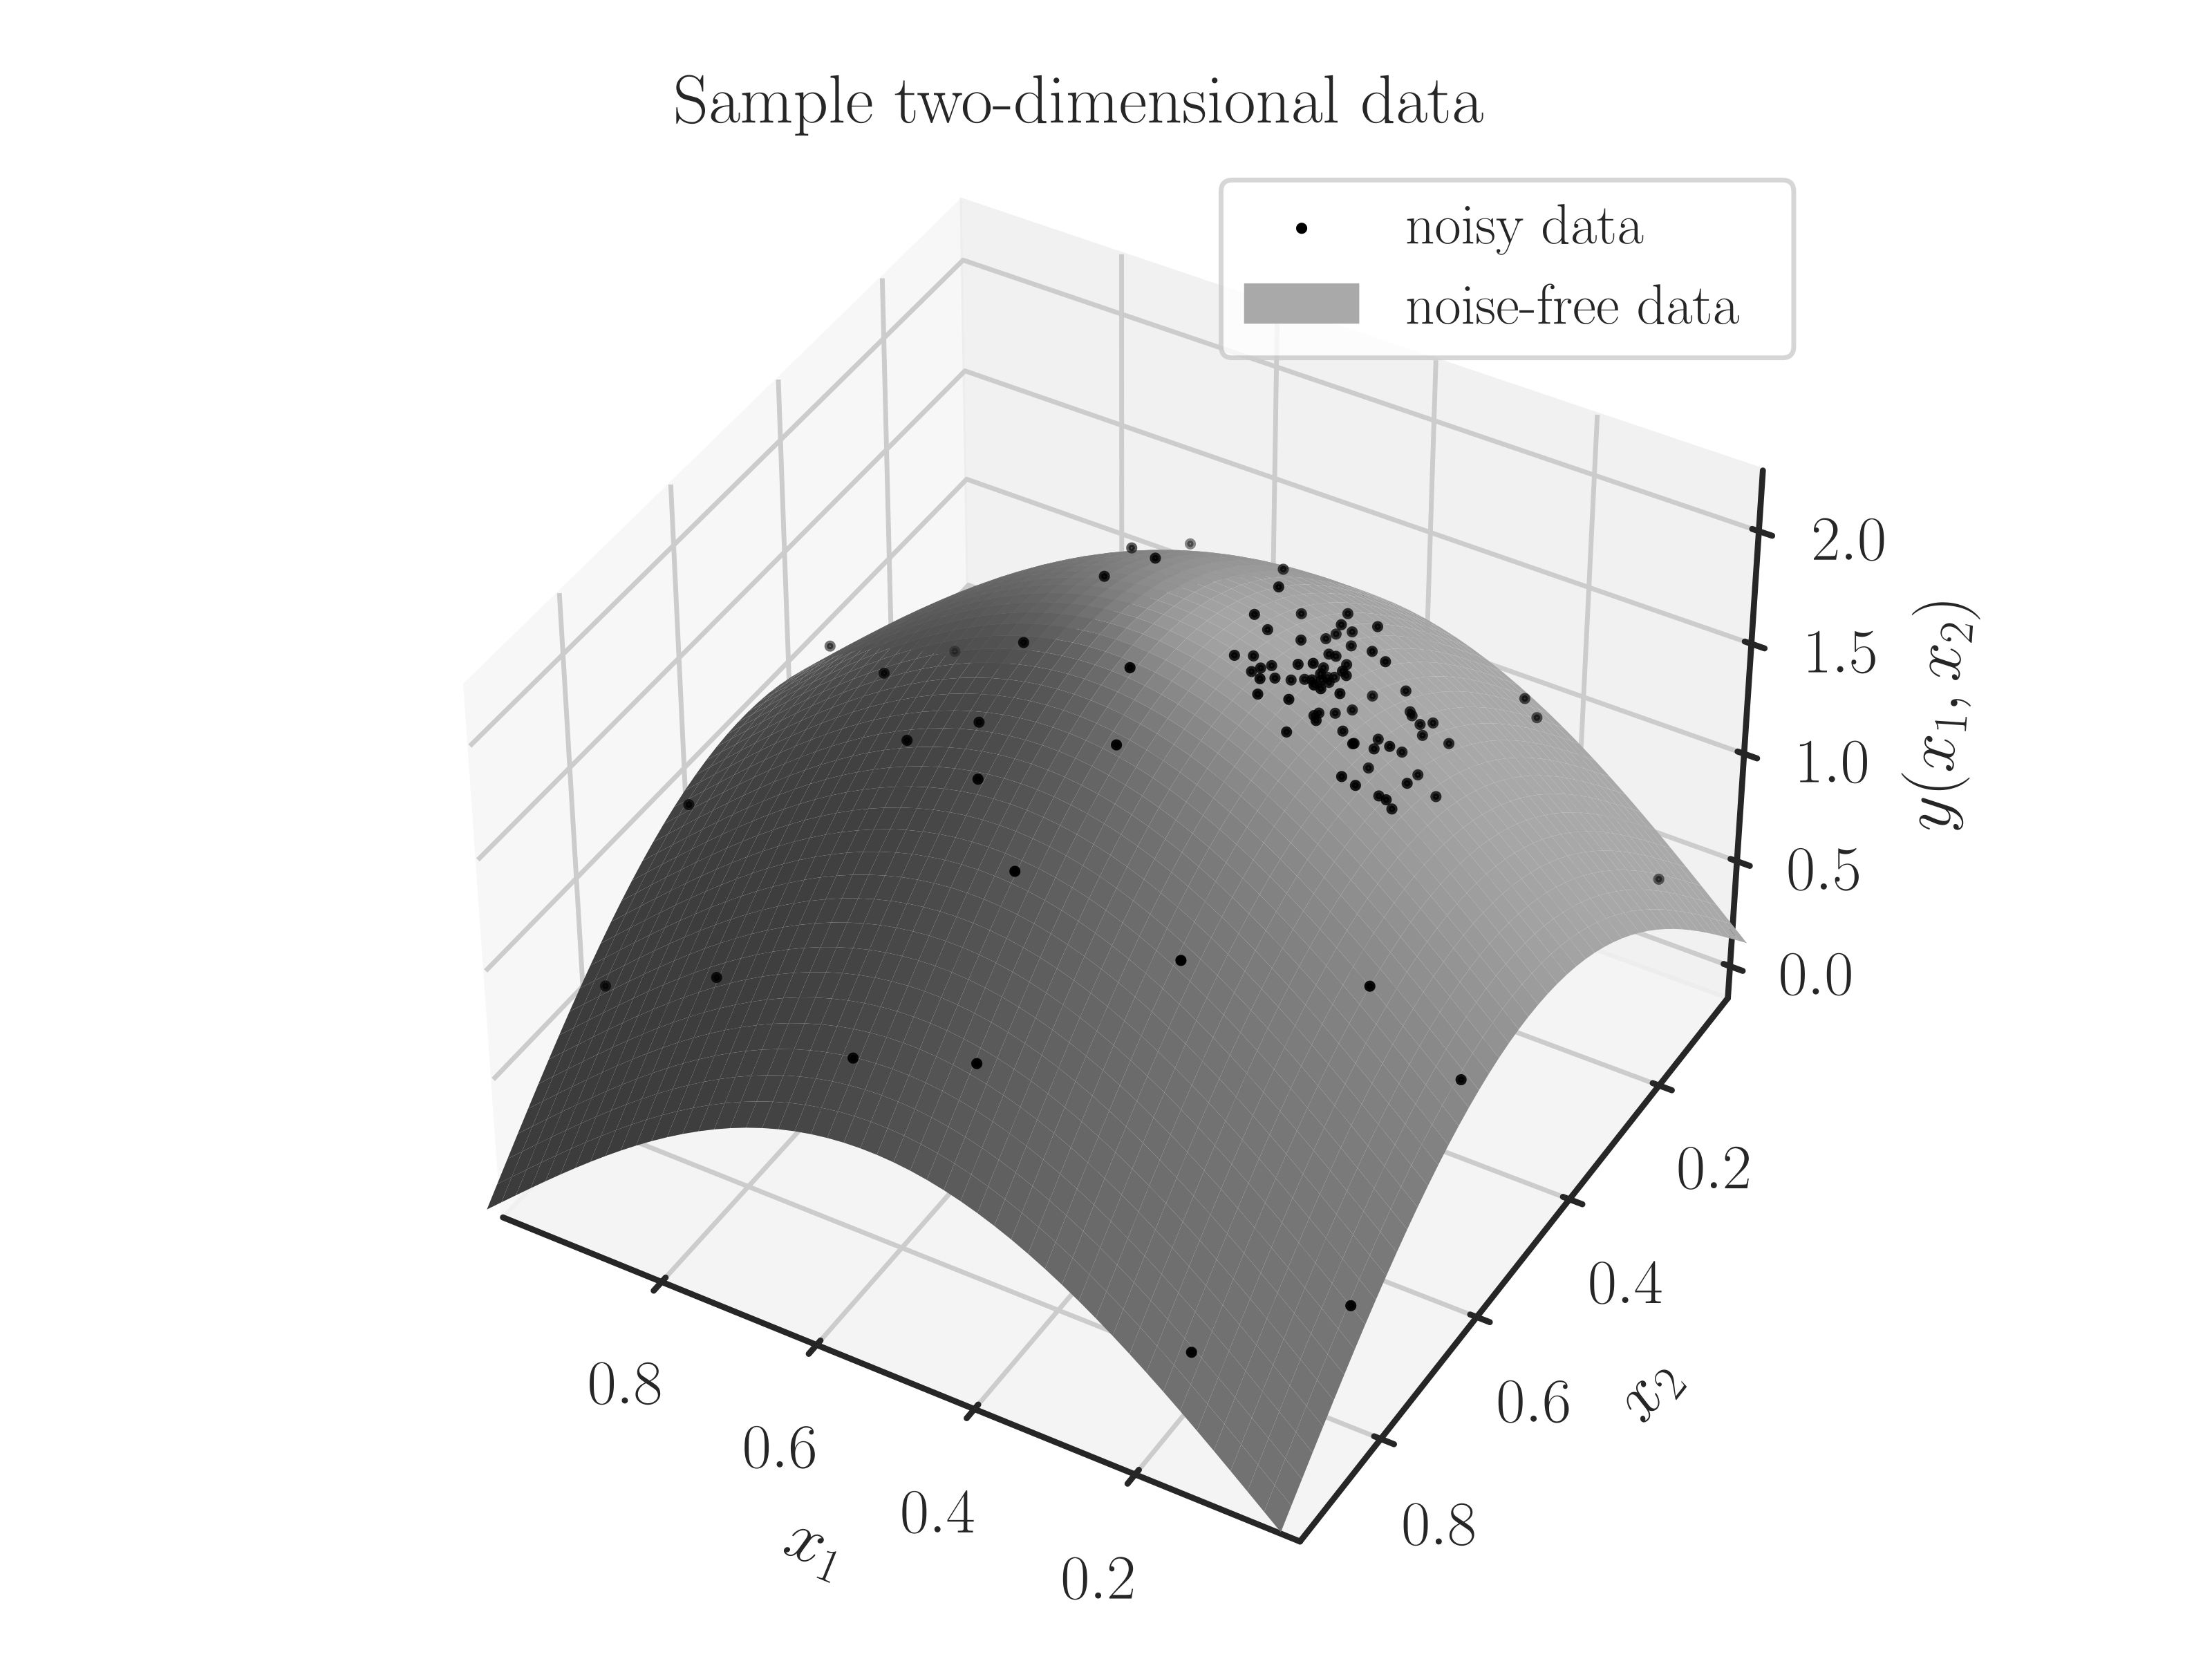
Two-dimensional Data:
Generate 100 random points on a 2-dimensional square \([0, 1]^2\) where \(70 \%\) more points are inside a rectangle with the corner points \(a=(0.2, 0.3)\) and \(b=(0.4, 0.5)\). Then, generate a noisy sinusoidal function on the set of points.
>>> from glearn.sample_data import generate_points, generate_data
>>> x = generate_points(100, dimension=2, grid=False, a=(0.2, 0.3),
...                     b=(0.4, 0.5), contrast=0.7)

>>> # Generate sample data
>>> y = generate_data(x, noise_magnitude=0.1, seed=0, plot=True)