glearn.kernels.Kernel.plot#
- Kernel.plot(self, compare_numerical=False, x_max=4.0, filename=None)#
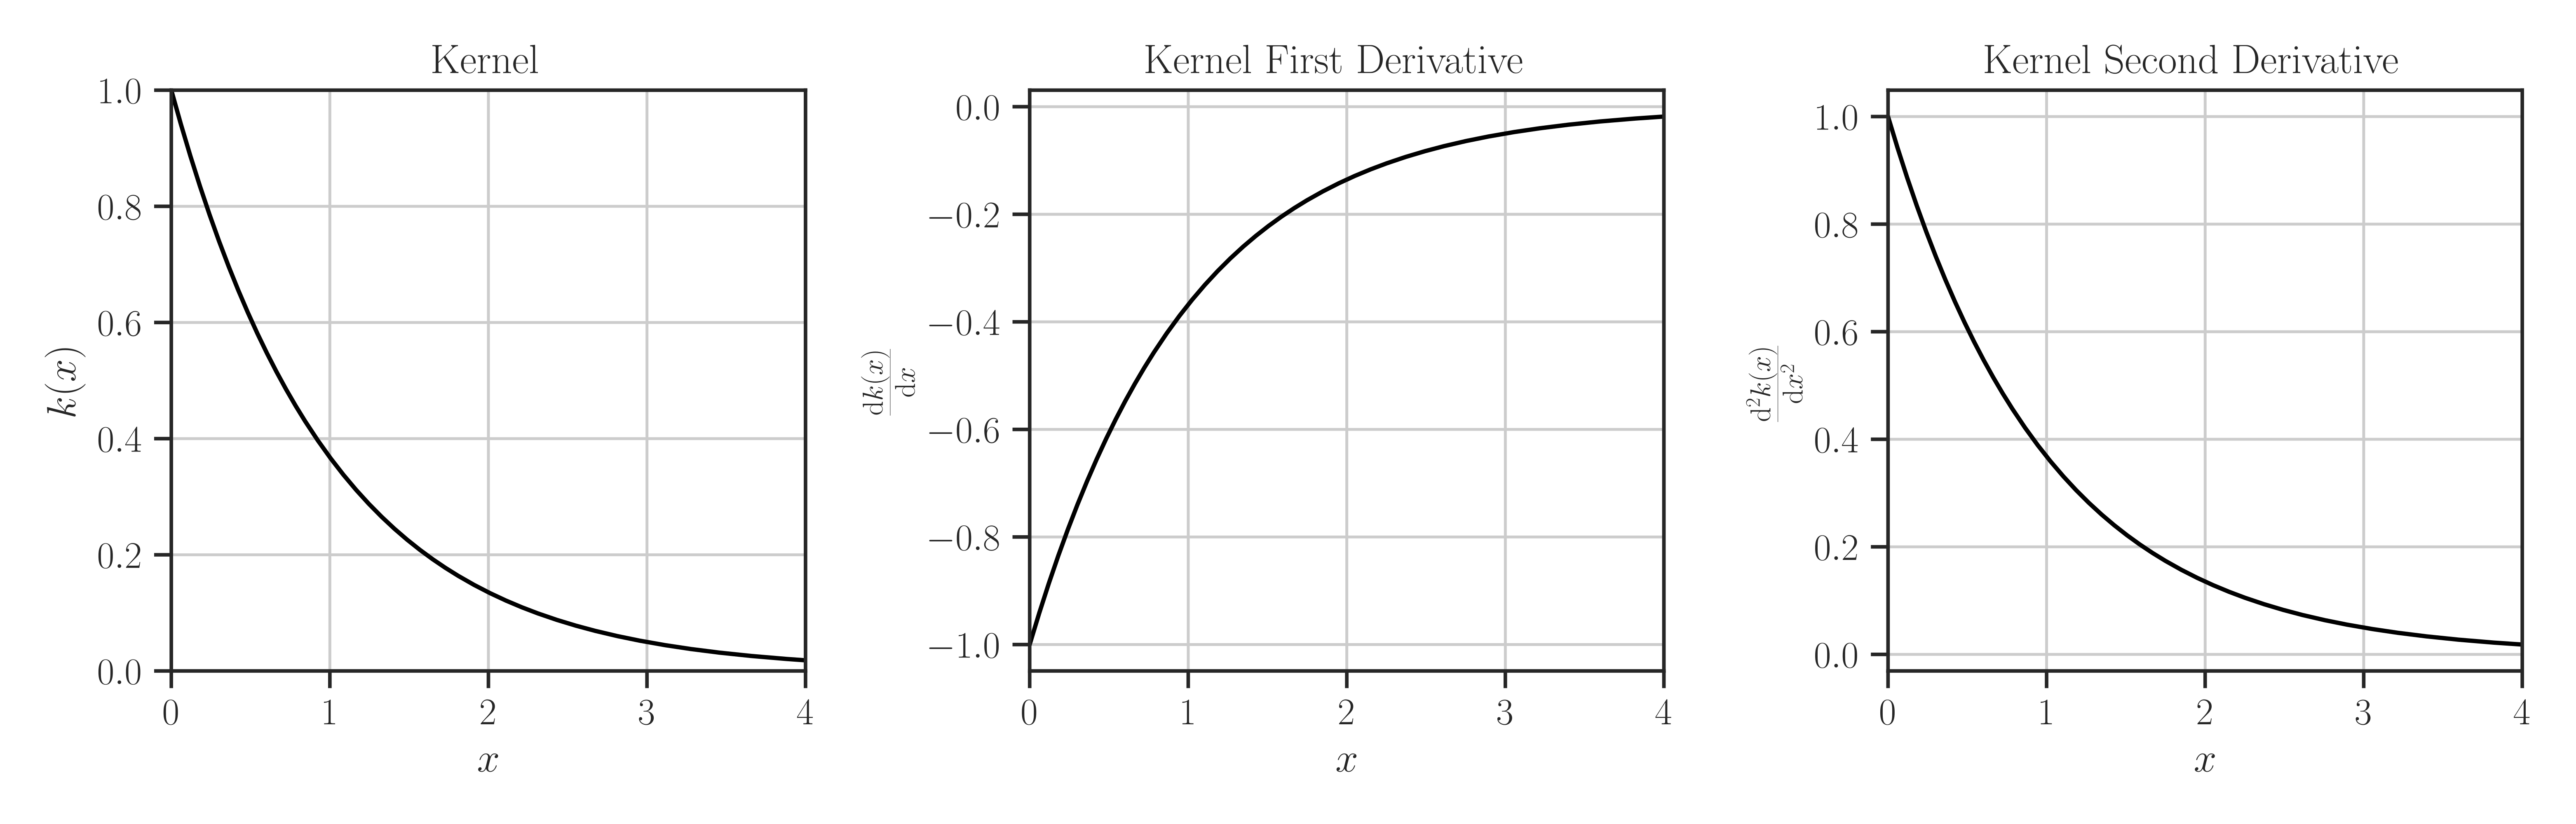
Plot the kernel function and its first and second derivative.
- Parameters:
- compare_numericalbool, default=False
It True, it computes the derivatives of the kernel function and plots the numerical derivatives together with the exact values of the derivatives from analytical formula. This is used to validate the analytical formulas.
- x_maxfloat, default=4.0
Maximum range in the abscissa in the plot.
- filenamestr, default=None
Name of file to save the plot. If None, the plot is shown, but not saved. If a string, the plot is not shown, but saved. If the filename does not have a file extension, the file is saved in both
svgandpdfformat. If the filename does not have a path, the plot is saved in the current directory.
Notes
If no graphical backend exists (such as running the code on a remote server or manually disabling the X11 backend), the plot will not be shown, rather, it will be saved as an
svgfile in the current directory.If the executable
latexis available onPATH, the plot is rendered using \(\rm\LaTeX\) and it may take slightly longer to produce the plot.If \(\rm\LaTeX\) is not installed, it uses any available San-Serif font to render the plot.
To manually disable interactive plot display and save the plot as
svginstead, add the following at the very beginning of your code before importingglearn:>>> import os >>> os.environ['GLEARN_NO_DISPLAY'] = 'True'
Examples
Create Kernel Object:
>>> from glearn import kernels

>>> # Create an exponential kernel
>>> kernel = kernels.Exponential()

>>> # Plot kernel and its first and second derivative
>>> kernel.plot()