imate.InterpolateSchatten.bound#
- InterpolateSchatten.bound(t)#
Bound of the interpolation function.
If \(p < 1\), this function is a lower bound, and if \(p > 1\), this function is an upper bound of the interpolation function.
- Parameters:
- tfloat or numpy.array
An inquiry point or an array of inquiry points.
- Returns:
- boundfloat or numpy.array
Bound function evaluated at t. If t is an array, the output is also an array of the size of t.
Notes
Define
\[\tau_{p}(t) = \frac{\Vert \mathbf{A} + t \mathbf{B} \Vert_p}{\Vert \mathbf{B} \Vert_p}\]and \(\tau_{p,0} = \tau_{p}(0)\). A sharp bound of the function \(\tau_{p}\) is (see [1], Section 3):
\[\tau_{p}(t) \leq \tau_{p, 0} + t, \quad p \geq 1, \quad t \in [0, \infty),\]\[\tau_{p}(t) \geq \tau_{p, 0} + t, \quad p < 1, \quad t \in [0, \infty),\]\[\tau_{p}(t) \geq \tau_{p, 0} + t, \quad p \geq 1, \quad t \in (t_{\inf}, o],\]\[\tau_{p}(t) \leq \tau_{p, 0} + t, \quad p < 1, \quad t \in (t_{\inf}, o],\]References
[1]Ameli, S., and Shadden. S. C. (2022). Interpolating Log-Determinant and Trace of the Powers of Matrix \(\mathbf{A} + t \mathbf{B}\). Statistics and Computing 32, 108. https://doi.org/10.1007/s11222-022-10173-4.
Examples
Create an interpolator object \(f\) using four interpolant points \(t_i\):
>>> # Generate sample matrices (symmetric positive-definite)
>>> from imate.sample_matrices import correlation_matrix
>>> A = correlation_matrix(size=20, scale=1e-1)
>>> B = correlation_matrix(size=20, scale=2e-2)

>>> # Initialize interpolator object
>>> from imate import InterpolateSchatten
>>> ti = [1e-2, 1e-1, 1, 1e1]
>>> f = InterpolateSchatten(A, B, p=2, ti=ti)
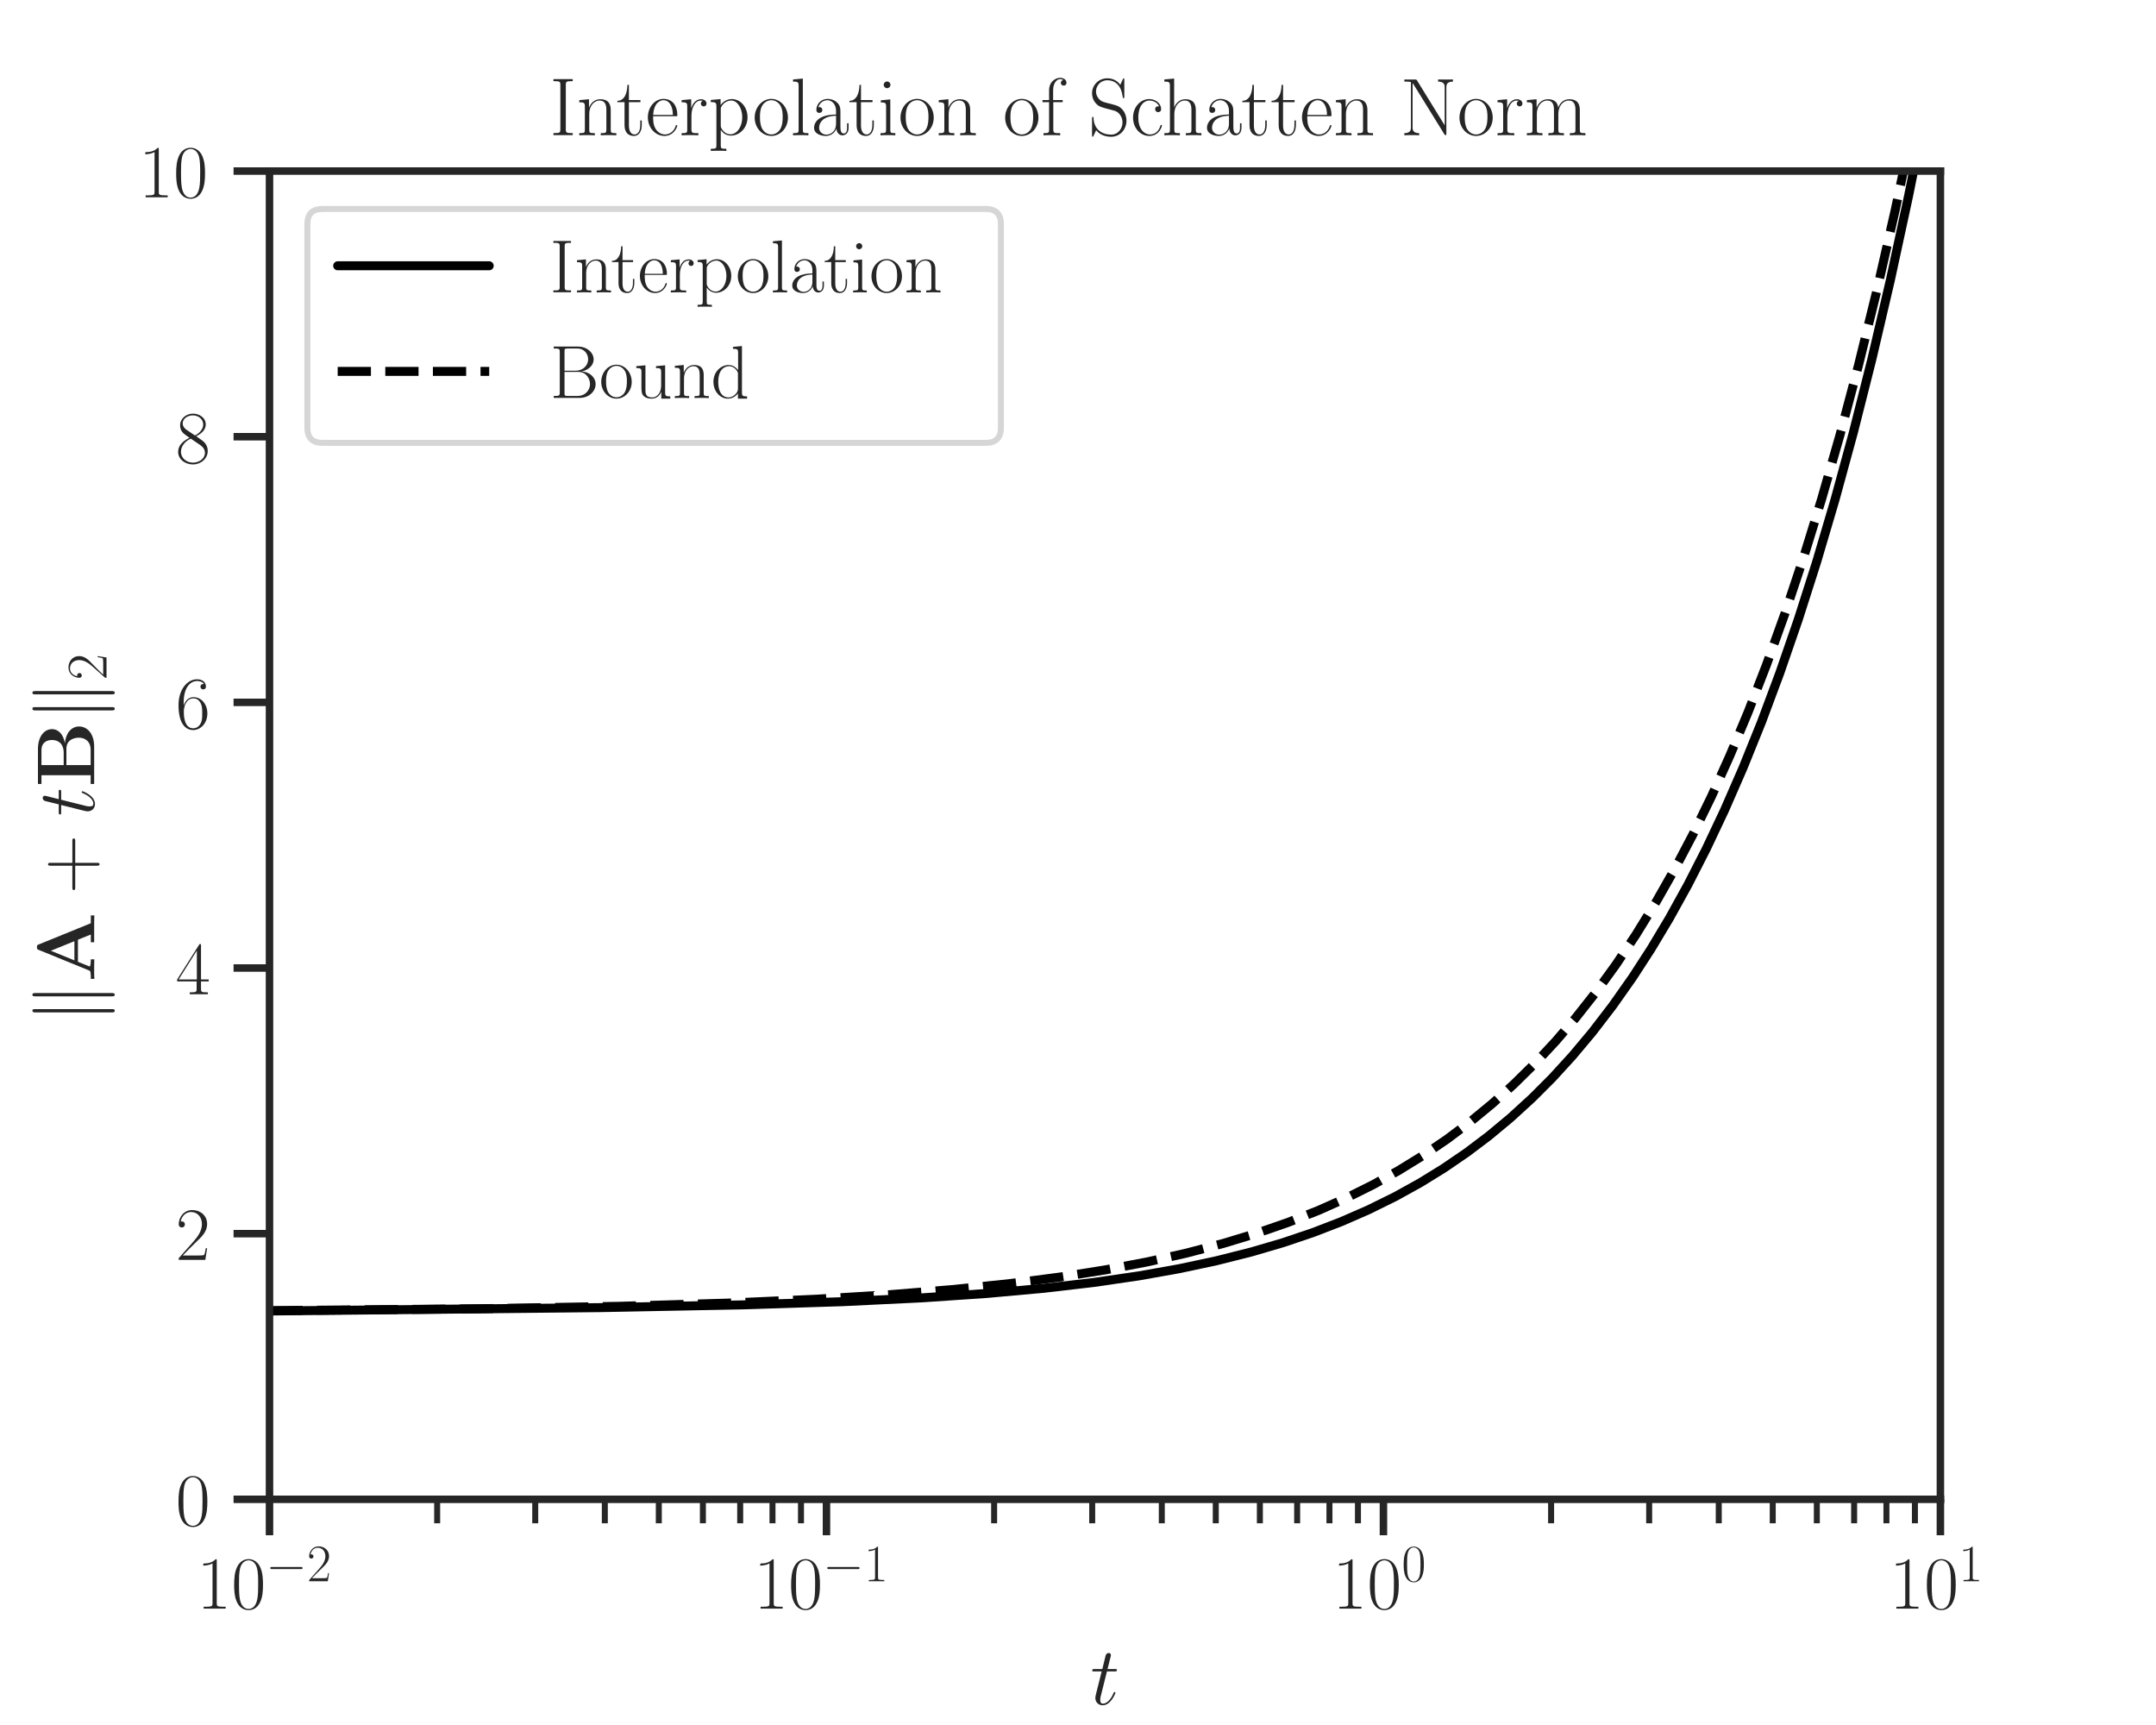
Create an array t and evaluate upper bound on t. Also, interpolate the function \(f\) on the array t.
>>> # Interpolate at an array of points
>>> import numpy
>>> t = numpy.logspace(-2, 1, 1000)
>>> bound = f.bound(t)
>>> interp = f.interpolate(t)
Plot the results:
>>> import matplotlib.pyplot as plt

>>> # Plot settings (optional)
>>> from imate._utilities import set_theme
>>> set_theme(font_scale=1.15)

>>> plt.semilogx(t, interp, color='black', label='Interpolation')
>>> plt.semilogx(t, bound, '--', color='black',
...              label='Bound')
>>> plt.xlim([t[0], t[-1]])
>>> plt.ylim([0, 10])
>>> plt.xlabel('$t$')
>>> plt.ylabel('$\Vert \mathbf{A} + t \mathbf{B} \Vert_{2}$')
>>> plt.title('Interpolation of Schatten Norm')
>>> plt.legend()
>>> plt.show()