imate.InterpolateTrace.lower_bound#
- InterpolateTrace.lower_bound(t)#
Upper bound of the interpolation function.
Note
This function only applies to \(p=-1\).
- Parameters:
- tfloat or numpy.array
An inquiry point or an array of inquiry points.
- Returns:
- ubfloat or numpy.array
Upper bound. If t is an array, the output is also an array of the size of t.
- Raises:
- ValueError
If \(p \neq -1\).
See also
Notes
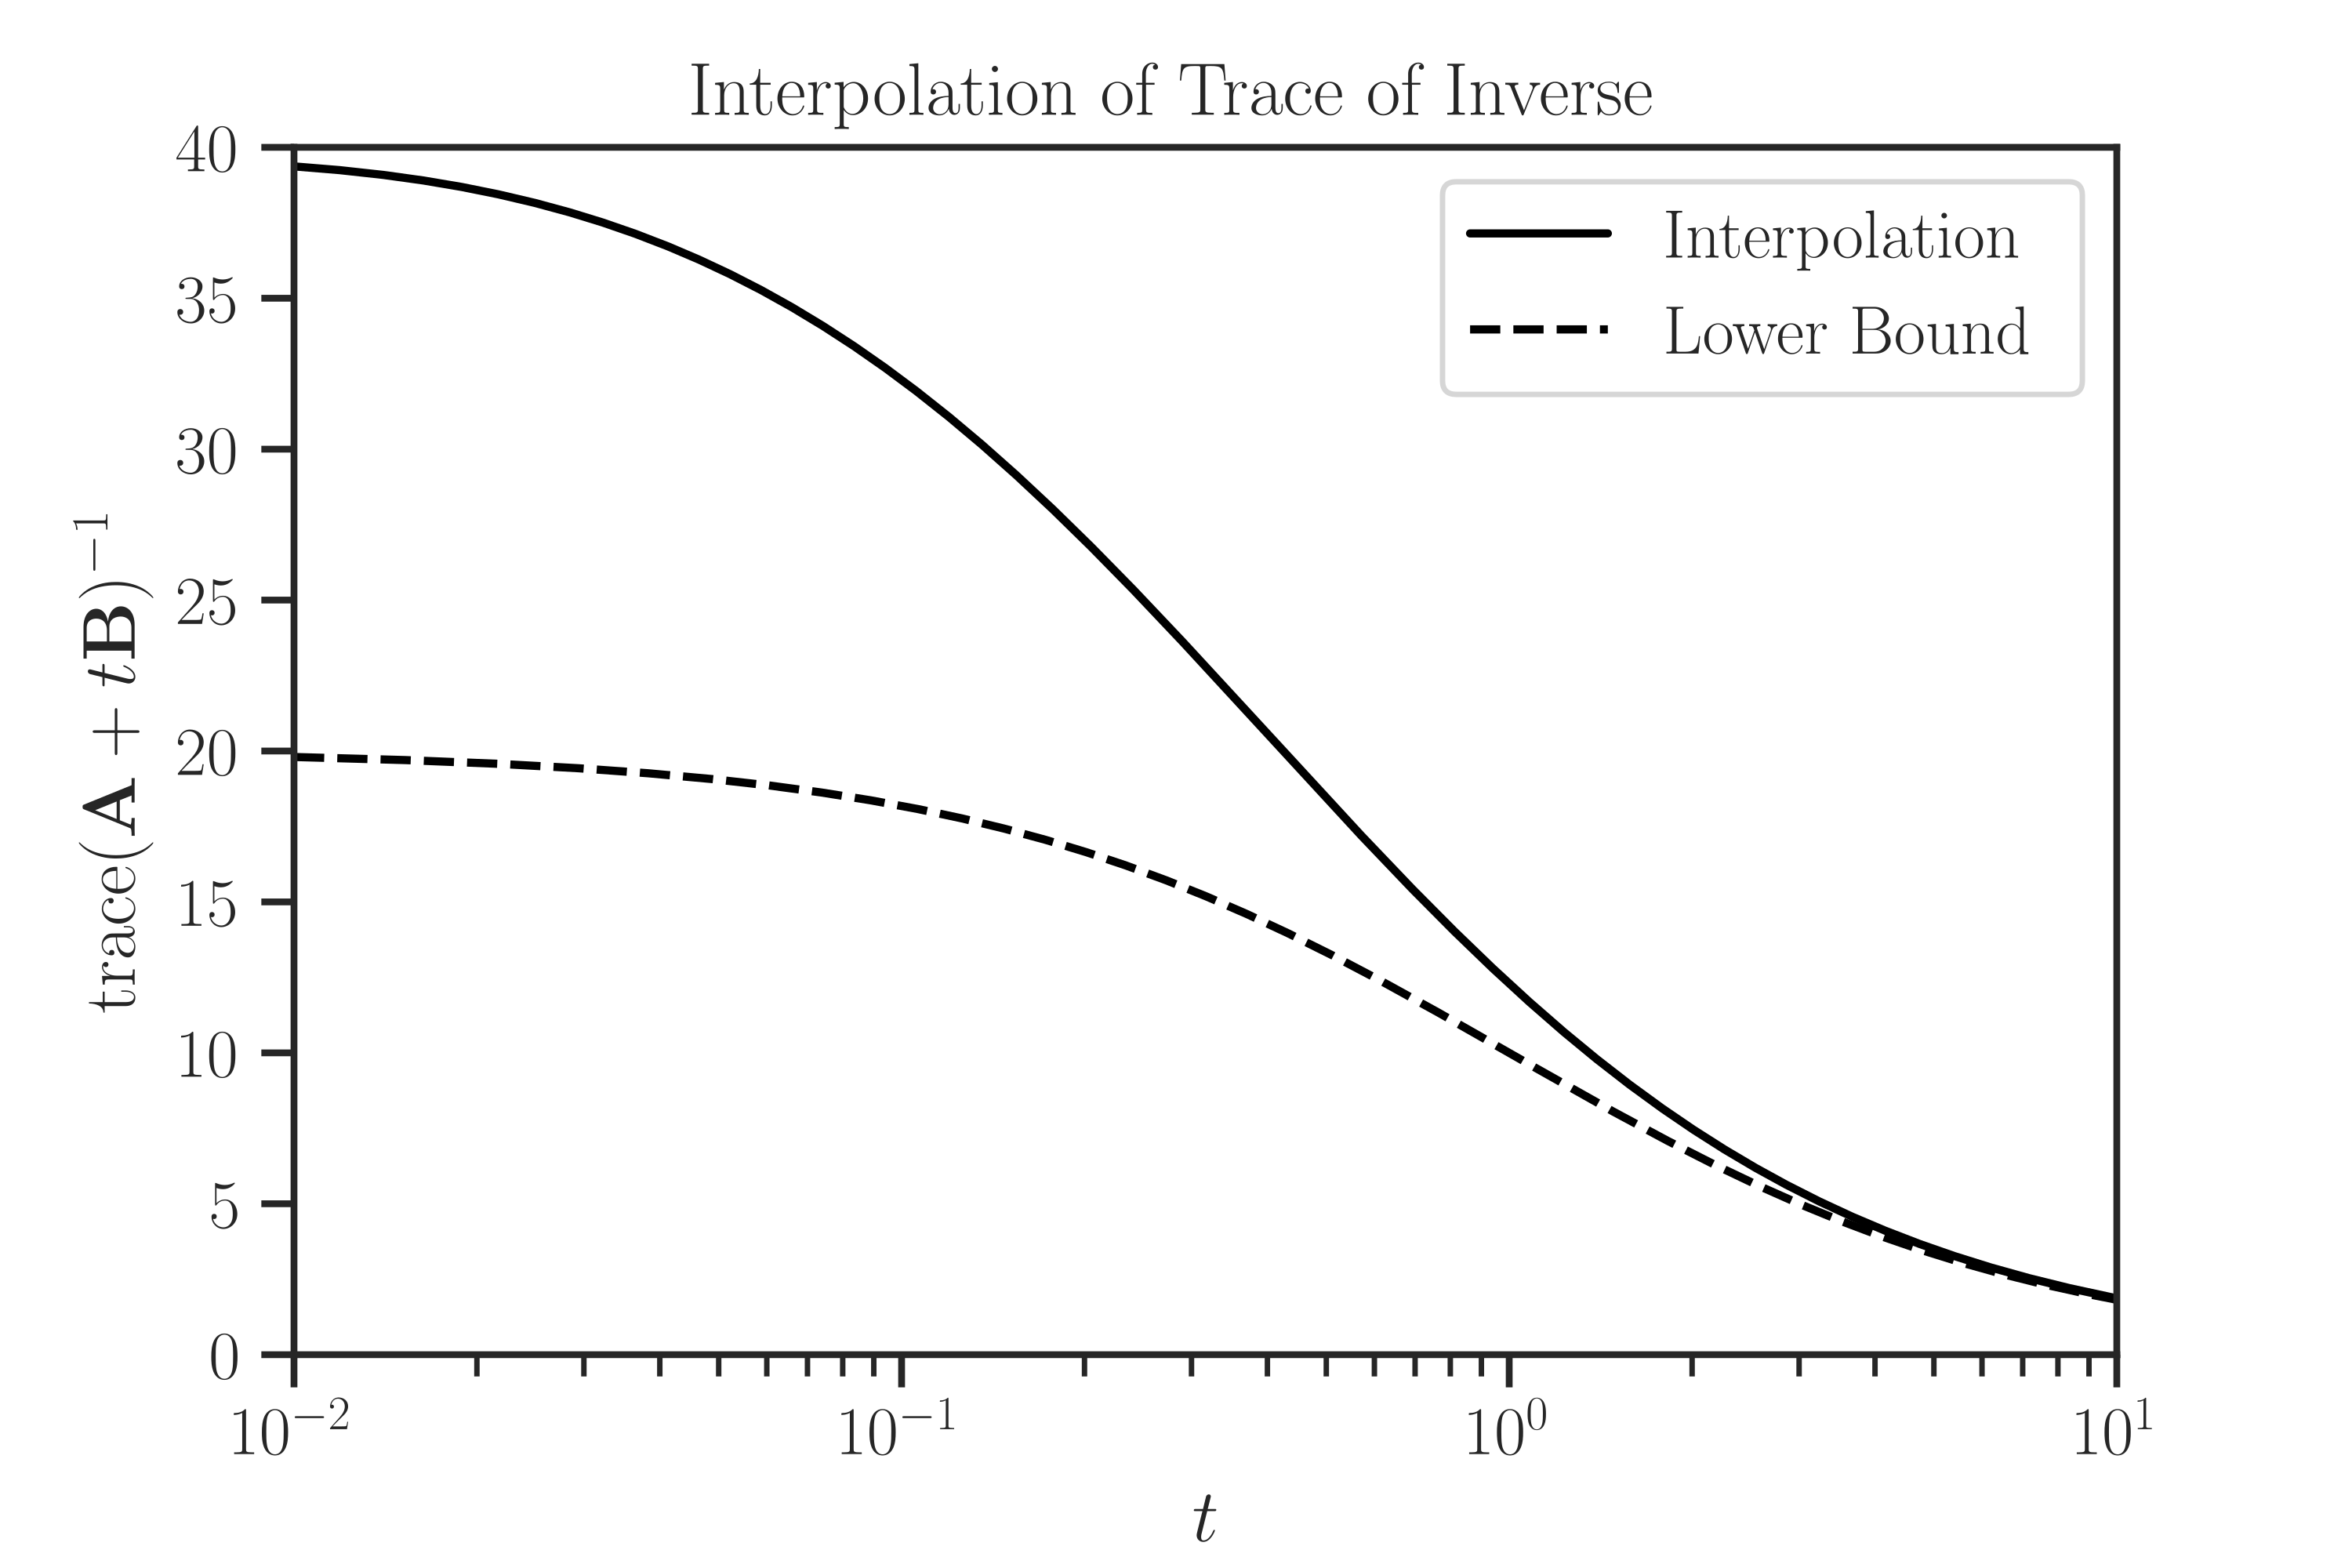
A lower bound function for \(\mathrm{trace} (\mathbf{A} + t \mathbf{B})^p\) is
\[\mathrm{trace}((\mathbf{A}+t\mathbf{B})^{-1}) \geq \frac{n^2}{\mathrm{trace}(\mathbf{A}) + t \, \mathrm{trace}(\mathbf{B})}\]Note that the above bound is not sharp as \(t \to 0\).
References
[1]Ameli, S., and Shadden. S. C. (2022). Interpolating Log-Determinant and Trace of the Powers of Matrix \(\mathbf{A} + t \mathbf{B}\). Statistics and Computing 32, 108. https://doi.org/10.1007/s11222-022-10173-4.
Examples
Create an interpolator object \(f\) using four interpolant points \(t_i\):
>>> # Generate sample matrices (symmetric positive-definite)
>>> from imate.sample_matrices import correlation_matrix
>>> A = correlation_matrix(size=20, scale=1e-1)
>>> B = correlation_matrix(size=20, scale=2e-2)

>>> # Initialize interpolator object
>>> from imate import InterpolateTrace
>>> ti = [1e-2, 1e-1, 1, 1e1]
>>> f = InterpolateTrace(A, B, p=-1, ti=ti)
Create an array t and evaluate upper bound on t. Also, interpolate the function \(f\) on the array t.
>>> # Interpolate at an array of points
>>> import numpy
>>> t = numpy.logspace(-2, 1, 1000)
>>> lb = f.lower_bound(t)
>>> interp = f.interpolate(t)
Plot the results:
>>> import matplotlib.pyplot as plt

>>> # Plot settings (optional)
>>> from imate._utilities import set_theme
>>> set_theme(font_scale=1.15)

>>> plt.semilogx(t, interp, color='black', label='Interpolation')
>>> plt.semilogx(t, lb, '--', color='black', label='Lower bound')
>>> plt.xlim([t[0], t[-1]])
>>> plt.ylim([0, 10])
>>> plt.xlabel('$t$')
>>> plt.ylabel('$\mathrm{trace}(\mathbf{A}+t\mathbf{B})^{-1}$')
>>> plt.title('Interpolation of Trace of Inverse')
>>> plt.legend()
>>> plt.show()